 Broadcast Wind is an
engineering consulting company founded in 2010 by broadcast industry veterans
to provide RF interference analysis for the wind and broadcasting industries
and to help establish the standards needed to ensure non-interference of turbine
blades with RF signals. Clients include
US broadcast station groups, the United States Department of Agriculture,
Exelon, NextEra Energy Resources LLC, and Invenergy LLC. Projects included AM, FM and television
interference studies, and baseline RF field studies (taken prior to wind farm
build-out). Broadcast Wind personnel
have presented to wind energy and broadcast industry trade groups, teaching the
importance of identifying radio and television interference issues prior to
wind farm construction. Broadcast Wind specializes
in Electromagnetic Interference Analysis (EIA) required by governing bodies
from wind farm developers during the wind farm permitting process with special
experience in interfacing with broadcasters to provide accurate information about
a wind farm’s effects on their signals and to relieve concerns about
signal loss.
Broadcast Wind is an
engineering consulting company founded in 2010 by broadcast industry veterans
to provide RF interference analysis for the wind and broadcasting industries
and to help establish the standards needed to ensure non-interference of turbine
blades with RF signals. Clients include
US broadcast station groups, the United States Department of Agriculture,
Exelon, NextEra Energy Resources LLC, and Invenergy LLC. Projects included AM, FM and television
interference studies, and baseline RF field studies (taken prior to wind farm
build-out). Broadcast Wind personnel
have presented to wind energy and broadcast industry trade groups, teaching the
importance of identifying radio and television interference issues prior to
wind farm construction. Broadcast Wind specializes
in Electromagnetic Interference Analysis (EIA) required by governing bodies
from wind farm developers during the wind farm permitting process with special
experience in interfacing with broadcasters to provide accurate information about
a wind farm’s effects on their signals and to relieve concerns about
signal loss.
TV Station Signals
Broadcast Wind provides wind farm developers and other
interested stakeholders (permitting agencies, investors, etc.) with predictions
of the effects of proposed wind farms on television signals. Included in these predictions are estimates
of number of viewers that would be affected – both directly off-air and via
cable from providers that pick up local programming off air. Estimates of impairment to cable off-air
pick-up is an important, although frequently forgotten, component of an EIA
because of the large number of viewers that may be affected. There are no national databases of cable
companies’ off-air receive sites. Local research
must be conducted to identify cable off-air signal pick-up points that may be
affected by construction of a wind farm..
A computer simulation desktop study is used to assess
potential for signal impairment due to a proposed wind farm. The strength of signals from television
stations whose coverage areas include the proposed wind farm site are simulated
in the regions surrounding the proposed site for with and without the wind farm. The software models electromagnetic wave
propagation taking into account effects of terrain variation on the
signal. The individual wind turbines are
modeled as additional path obstructions in the terrain.

The cells in the Area
of Potential Interference are where the simulated signal strength dropped to an unacceptable level, post construction.
Probe Data – TV Dashboard
Broadcast Wind uses proprietary stationary remote RF probes to
provide our wind farm developers and stakeholders with long term TV signal
strength and signal quality data critical
locations prior to and following the construction of wind farms. Similarly to the way meteorological gear is used
by the wind industry, prior to and following wind farm construction to gather
wind data over a period of time, our RF probes capture TV signal metrics through
changes in seasons, and atmospheric conditions before, during, and after wind farm construction. The probe data provides Broadcast Wind and
the wind farm developers with reliable documentation of changes (if any) to
signal quality consequential to construction.
The probe data is forwarded to Broadcast Wind’s offices and
optionally to a client’s office where it can be displayed on a concise
graphical data dashboard and can be programmed to provide alerts if parameters
go out of defined limits. Dashboard data
can be viewed remotely by hour, day, month and year. A roll of the mouse allows the user to see
what was going on with atmospheric conditions at the time of the probe reading.
In the following dashboard example we see correlation
between UHF signal variation and precipitation.
Precipitation, high wind, time of day, and seasonal changes can all play
a role in UHF DTV signal propagation.


TV Probe Metrics:
The top three graphical metric lines are displayed on a
common percent scale for convenience of visualization. The fourth, margin, is
displayed in dBmv. The inset box provides the measurement data.
- The TV signal “SEQ” tells us whether the video signal is watchable. An SEQ of 99% would mean that the viewer sees a ”hit” (I.e. pixilation) to the video 1% of the time that they are watching.
- Signal strength in dBmv and signal quality (MER) in dB are also captured.
- “Margin” describes how much signal strength buffer there is within the channel before the signal would start to fall apart. More margin means a stronger, more stable video signal.
No single metric completely describes the quality of the
signal reception. The value of the
dashboard is that it presents multiple metrics that can be correlated with each
other and with external factors.
AM and FM Broadcast Radio Stations
AM broadcast stations’
exclusion distance varies depending upon antenna type and broadcast frequency. Omni
directional (non-directional) antennas, have an exclusion distance equal to 1 wavelength. For AM antenna arrays (directional antennas),
the exclusion distance is the lesser of 10 wavelengths or 3 kilometers. AM broadcast coverage problems are only
anticipated when AM broadcast antennas are located within the exclusion
distance limit of wind turbine towers.
The coverage of FM
stations at distances greater than 4.0 km from wind turbines, is not subject to
degradation. FM transmitters with
antennas closer than 4.0 km from proposed wind turbines can, under some
conditions, experience a compromised signal.
Similar to the TV signal analysis above, Broadcast Wind
conducts a desktop study to determine potential areas of interference for FM radio
stations. Remote RF signal probes
accessorized with long term FM signal quality logging capabilities are placed
within areas with the highest risk for signal compromise prior to, during and
following the proposed wind farm construction.
Probe Data – FM
Dashboard
Broadcast Wind’s remote stationary probes can also monitor
FM radio signals and forward them to our offices and to a client’s offices for
display on a dashboard. FM signal
metrics are stored on the cloud where they are available for review by
Broadcast Wind’s clients.

Point-to-Point Microwave Systems
 Point-to-point microwaves that may be affected
by the installation of wind farms operate over a wide range of frequencies (900
MHz – 23 GHz). These microwave systems provide
a wide range of telecommunication backhaul throughout the country supporting
essential services such as land based telephone services, cellular networks,
personal communication services; data and internet interconnects, network
controls for utilities and railroads, and various video services.
Point-to-point microwaves that may be affected
by the installation of wind farms operate over a wide range of frequencies (900
MHz – 23 GHz). These microwave systems provide
a wide range of telecommunication backhaul throughout the country supporting
essential services such as land based telephone services, cellular networks,
personal communication services; data and internet interconnects, network
controls for utilities and railroads, and various video services.
Every
point-to-point interconnect analysis must begin with solid geolocation
information. In some cases, a field
survey may be recommended to validate tower coordinates found on governmental
web sites to assure predictive model accuracy and to avoid issues of interference
following construction.
Once the accuracy
of GPS data is assured, a two dimensional (2D) analysis is performed to
determine whether any microwave signals intersect a proposed wind turbine’s
footprint.

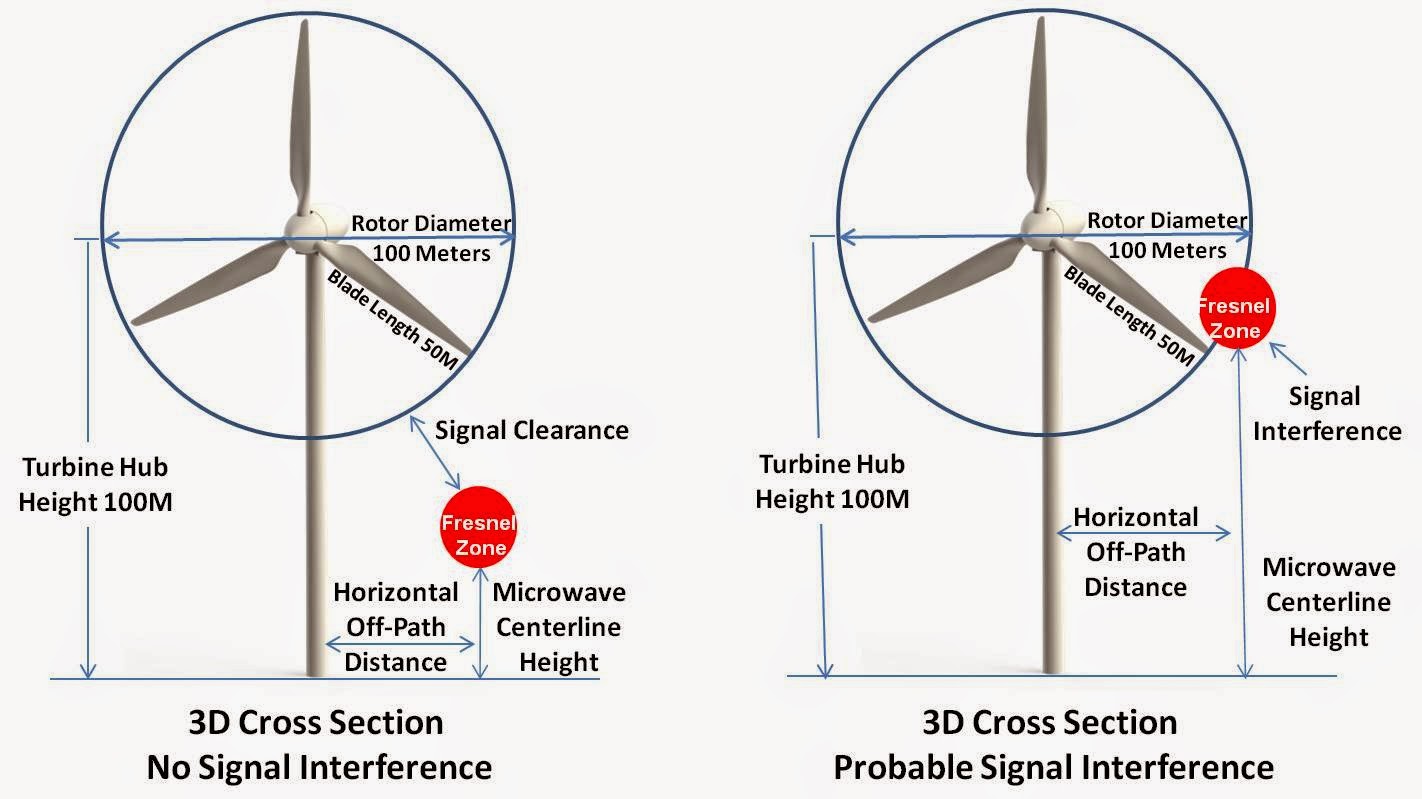
Once
a 2D analysis is complete, a 3D analysis (pictured below) allows us to
determine whether the signal is able to safely pass under or above the turbine blades
without interference from the blades.
Point-to-Multipoint Microwave Systems
 Wireless Internet Service Providers (WISPs)
deliver Internet and other data services via radio transmission to business
and/or residential subscribers. WISPs can use frequency bands in both licensed and
unlicensed spectrums. Many rural
community WISPs operate in the unlicensed spectrum since the initial capital
outlay and ongoing operating costs are low.
The most common unlicensed bands used for this purpose are the 900 MHz,
2.4 GHz, and 5.8 GHz bands. Since there
aren’t any governmental databases containing local WISP information, site
surveys and local town business research is needed to identify, and work with
major WISP operators prior to construction and to help plan for and mitigate
WISP user interference issues following construction. Broadcast wind can identify the WISP service
providers and receivers in the vicinity of a proposed wind farm for clients and
determine by 2D and 3D analysis if the blades of any of the proposed turbines
will interfere with the WISP subscribers’ signals.
Wireless Internet Service Providers (WISPs)
deliver Internet and other data services via radio transmission to business
and/or residential subscribers. WISPs can use frequency bands in both licensed and
unlicensed spectrums. Many rural
community WISPs operate in the unlicensed spectrum since the initial capital
outlay and ongoing operating costs are low.
The most common unlicensed bands used for this purpose are the 900 MHz,
2.4 GHz, and 5.8 GHz bands. Since there
aren’t any governmental databases containing local WISP information, site
surveys and local town business research is needed to identify, and work with
major WISP operators prior to construction and to help plan for and mitigate
WISP user interference issues following construction. Broadcast wind can identify the WISP service
providers and receivers in the vicinity of a proposed wind farm for clients and
determine by 2D and 3D analysis if the blades of any of the proposed turbines
will interfere with the WISP subscribers’ signals.
Land Mobile
and Emergency Services

Evaluation is needed for first responder entities:
police, fire, emergency medical services, emergency management, hospitals,
public works, transportation and other state, county, and municipal agencies. Generally
land mobile and emergency radio systems are designed with multiple transmitters
to provide redundancy so the service will not be interrupted as the receiving
radio moves into and out of areas of signal blockage. Never-the-less a thorough assessment of the
effect of a proposed wind farm on emergency services radio signals is an
important, yet frequently overlooked aspect of an electromagnetic impact
analysis. The building of a densely
populated wind farm can be analogous to the placement of a city with hundreds
of tall structures between an emergency transmitter and the emergency
responder. If signal levels are
attenuated following construction, higher powered transmitters, repeaters or
signal boosters may be employed to fill the compromised area. The key to success in this area is the performance
of a thorough RF field analysis prior to construction. An analysis of this type will identify the
industrial and business land mobile radio systems and commercial E911 operators
near the proposed wind energy facility.
Mobile Phone Systems

Modern mobile phones
support a wide variety of personal communication services including telephony, text
messaging, email, and internet access. The
major US mobile phone service providers currently support three digital technologies:
legacy 2G (voice and limited data), main
stream 3G and newer, faster 4G. Mobile
phone services are divided into three categories, each operating in its own
frequency bands. Advanced Wireless Service (AWS), Personal Communication
Service (PCS), and Cellular (CLR). They
hold licenses on an area-wide basis which are typically comprised of several
counties.
Wind turbines
present no significant threat to mobile phone services. The mobile phone system architecture is based
on low-latency packet switching and redundant cellular geographic
coverage. Packets are dynamically routed
among cells as mobile phones change location and as network traffic
changes. A given mobile phone conversation
is typically made up of packets that travel different routes and are assembled
seamlessly at their destination. If a
given cellular link is unavailable for any reason – interference from a wind
turbine or other - the packet is automatically switched to another cell with no
interruption of service. The user of the
phone is unaware of cellular transitions, so will not be affected by any that
may be triggered by a wind turbine.
Government Radar Systems
Wind Farm siting can potentially affect
government radar systems. The Department
of defense offers a Preliminary Screening Tool[2]
that can be used by wind farm developers to determine if there will be
interference to air defense and homeland security radars (long range radars), to
weather surveillance radar – Doppler radar (NEXRAD), or to military operations
radars. Broadcast Wind can assist
clients with preparation and use of this preliminary screening tool.
The FAA requires that all developers
proposing a wind farm with turbines that exceed 200 feet above ground level file
a Notice of Proposed Construction or Alteration form[3]. For each turbine in the farm the form must
specify the turbine ID number, latitude and longitude in degrees, minutes and
seconds (NAD 83), site elevation, height above ground level (AGL), overall
height above mean sea level (AMSL), and preferred marking and lighting. Upon approval of the proposal, the FAA will
issue a Determination of No Hazard.
Broadcast Wind can assist clients with preparation and submission of the
Notice of Proposed Construction or Alteration form to the FAA.
Commercial Doppler Radar
Commercial Doppler radars are located on television towers to
take advantage of their height. They are
either operated by the broadcaster to support the station’s local weather forecasting
service or leased to other commercial parties for private weather monitoring or
forecasting. A wind developer needs to
know if his turbines will be in the line of sight of any Doppler radars. The curvature of the earth determines the
minimum separation distance below which a wind turbine is in the line of sight
of a distant radar. If the separation
distance is less than the sum of the distances to the horizon of each object the
turbine will be in the radar’s line of sight.
The separation distance below which a turbine is in the line
of sight is given by the following equation.
Dseparation
= 3.57 x ((Hturbine)1/2 + (Hradar)1/2)
x 1000
Where all dimensions are in the same units.
For example, a turbine with blade tip height 150 meters above
ground will be within the line of sight of a radar on a tower 300 meters above
ground if the distance between them is less than 106 kilometers.
Broadcast Wind can locate and identify the commercial
Doppler radars within line of sight of the turbines in a proposed wind farm for
clients.
Telecommunication Towers
 A comprehensive survey of all communication
The survey can be extended to on-site verification of tower
locations in case there are errors in the location information on file in registered
data bases. This verification will
ensure the accuracy of the predicted impact of the wind turbines on microwave,
television, and radio signals. Broadcast
Wind can identify and confirm the precise location of all communications towers
in the vicinity of a proposed wind farm for clients.
Conclusion
Accurate pre-construction identification and characterization
of potential interference to electromagnetic transmissions is vital to the
success of a wind energy project, both for permitting and for avoidance of
post-construction problems. Television
and radio broadcasting signals are especially critical because they directly
impact the public. At the permitting
stage an energy developer can encounter local resistance based on fear of loss
of television or radio reception and after construction it can be confronted
with costly claims for remediation of (real or imagined) service loss.
Broadcast Wind can provide the full spectrum of electromagnetic
interference assessment. In addition we
bring special expertise and experience in areas of television and radio
broadcasting. This experience includes detailed
characterization of the predicted effect of proposed wind farms on broadcasting
signals with the added benefit of remote probes for long term in-the-field monitoring
of signal strength prior to and after construction. Long term monitoring provides the developer
with forensic evidence that can protect him from invalid claims for restoration
of service. Our experience also includes interfacing with
broadcasters at the beginning of a project to relieve possible exaggerated or
misplaced fears that could lead to avoidable obstacles to successful
permitting.
[1] FCC
OET BULLETIN No. 69, Longley-Rice Methodology for Evaluating TV Coverage and
Interference, February 6, 2004
[2] https://oeaaa.faa.gov/oeaaa/external/content/deskReferenceGuides/DoD%20Preliminary%20Screening%20Tool%20-%20Desk%20Reference%20Guide%20V_2014.2.0.pdf
[3]
FAA Form 7460-1


